Solar development is booming, but outdated policies and grid limitations are slowing progress—risking lost ROI. Discover the data and strategies needed to stay competitive.
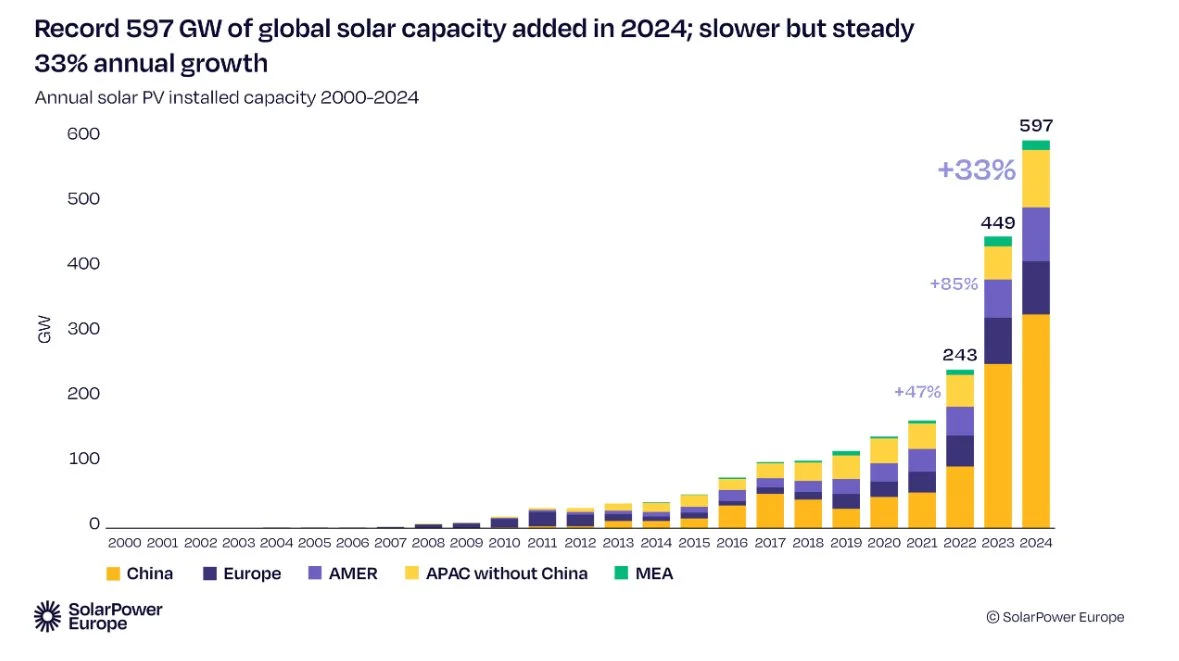
According to SolarPower Europe’s 2025–2029 outlook, global PV installations reached 597 GW in 2024, and may exceed 1 TW per year by 2028—marking a new solar era.
Stay tuned to uncover what this means for your sourcing strategy and market positioning.
What Is the Global Outlook for PV Installations from 2025 to 2029?
The recently released Global PV Market Outlook 2025–2029 by SolarPower Europe provides a deep dive into the future of solar energy, highlighting both tremendous growth and looming challenges. In 2024, the world saw an unprecedented 597 GW in new PV capacity, a figure that accounts for 81% of new renewable energy installations. Even more striking: solar outpaced all other energy sources globally in newly installed capacity.
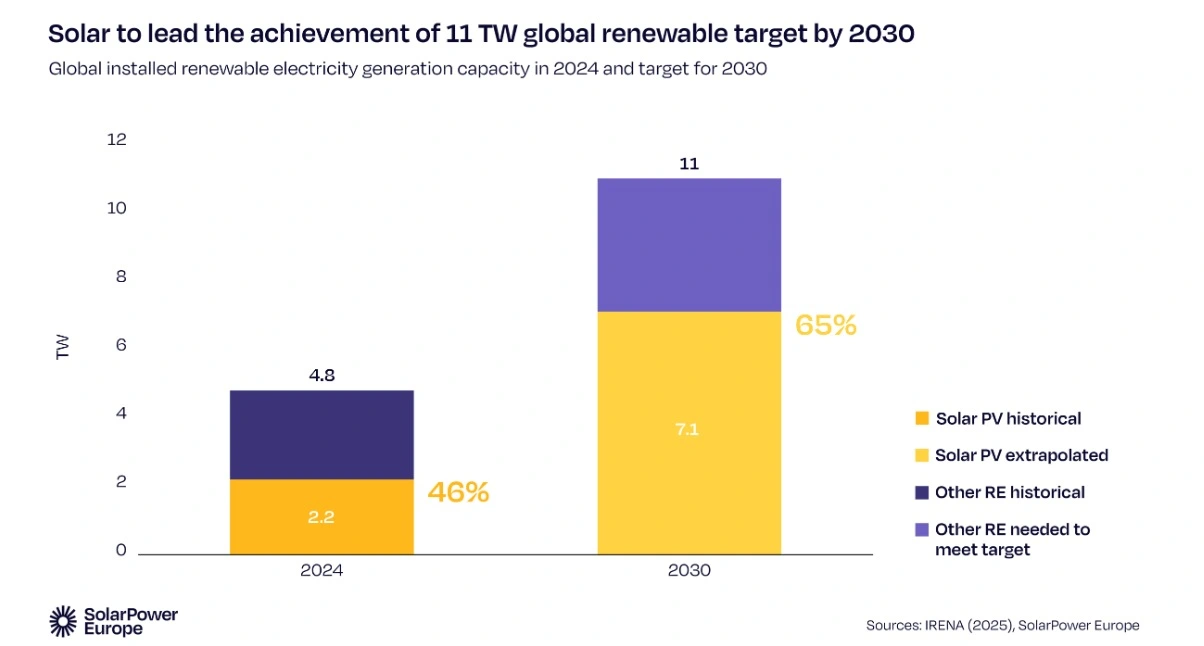
Looking ahead, the report projects that global PV installation could reach 774 GW in 2025, and in an optimistic scenario, break the 1 TW/year milestone by 2028. By 2029, even in a moderate case, new installations are expected to touch 930 GW annually. This sustained acceleration is critical to achieving COP28’s renewable energy target of 11 TW by 2030, with solar potentially contributing 7.1 TW of that.
But these gains come with risks—particularly the overdependence on China, unpredictable policy shifts in major markets, and infrastructure limitations that could throttle solar’s pace. Suppliers, integrators, and buyers must remain agile to navigate this new terrain.
Why Is China Still the Center of the Global PV Supply Chain?
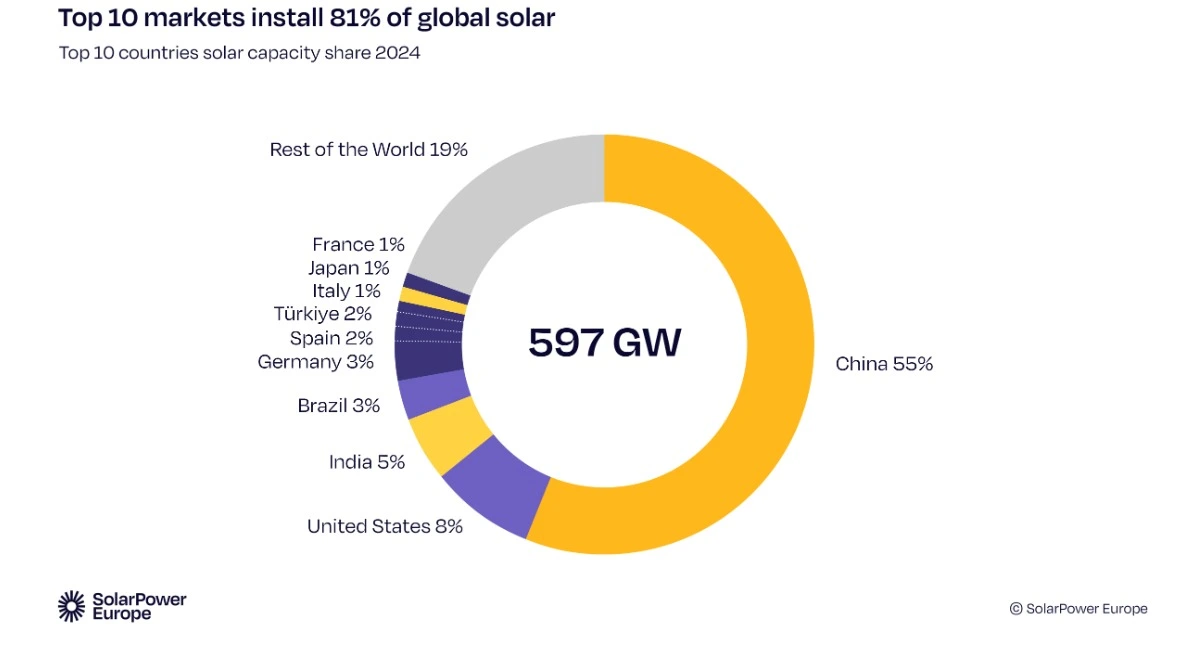
China remains the undisputed leader in solar PV, accounting for 329 GW of installations in 2024 alone—a staggering 55% of global market share. This dominance isn’t just in deployment; China also leads the entire solar manufacturing value chain, from silicon to panels and inverters.
Chinese factories have pushed solar component prices to historic lows, primarily through scale, overcapacity, and automation. These price cuts make solar more affordable globally, but they also create a fragile dependency. Any policy reform or production shift in China—like the upcoming 2025 solar market restructuring—could cause global ripples in price and supply stability.
For global buyers and EPC contractors, partnering with reliable, certified Chinese manufacturers like USFULL ensures pricing advantages without compromising on quality or delivery.
How Is India Emerging as a Key Solar Growth Market?
India’s transformation into the third-largest solar market by 2024 is one of the biggest stories of this decade. The country doubled its annual PV installation to nearly 30 GW, supported by a national energy security strategy and a growing population with energy access needs.
According to SolarPower Europe’s report, India is on track for continued double-digit annual growth, fueled by favorable policies, domestic production incentives, and grid expansion programs. Its trajectory positions it as the second-most influential market in shaping global solar demand after China.
For suppliers, India offers a diversified procurement landscape with opportunities for OEM partnerships, private-label products, and utility-scale project integration.
Will We Really See 1 Terawatt of New Solar Capacity in a Single Year?
Breaking the 1 TW/year installation mark is the next milestone for the solar industry—and we’re closing in fast. After taking 70 years to reach the first terawatt (in 2022), the world added a second in just two years (2024), with global cumulative installations now at 2.2 TW.
The report outlines two possible paths:
- Optimistic scenario: 1 TW/year could be achieved by 2028
- Moderate scenario: milestone pushed to 2030
But for either path to materialize, countries must address grid integration, policy alignment, and financing mechanisms. A surge in capacity without infrastructure readiness can lead to negative electricity prices, curtailment, and investor losses.
For B2B solar buyers, this means focusing not just on modules but on end-to-end systems—like solar pump inverters, combiner boxes, and protection devices that ensure system resilience.
How Are Regional Markets Shaping the Future of Solar?
SolarPower Europe’s report includes deep analysis of 20+ GW-level PV markets. Here are the key trends:
- Asia-Pacific dominates, responsible for 70% of new capacity, driven by China, India, and Southeast Asia.
- Europe grew by 15%, with 82.1 GW installed, showing strong commitment to green energy even amid political uncertainty.
- North and South America grew 40%, signaling a mature but stable expansion phase.
- Middle East & Africa, however, saw a 2% YoY decline—highlighting the need for better policy frameworks and investment confidence.
The regional variation reveals why diversified sourcing and multiple logistics pathways are essential to maintaining consistent project execution.
What Role Does Policy Still Play in PV Growth?
The solar sector may have achieved grid parity in most regions, but macroeconomic and regulatory policies still matter—a lot.
From China’s electricity pricing reforms to the U.S.’s Inflation Reduction Act (IRA), and from EU’s net metering reviews to developing countries’ subsidies—every policy shift impacts investor behavior, installation timelines, and technology preferences.
As 2025 approaches, SolarPower Europe warns that solar growth may temporarily slow to 10%, with 655 GW projected—reflecting cautious capital flow and system-level saturation risks.
Now more than ever, buyers and developers must stay informed and align procurement decisions with upcoming regulatory trends to protect margins and project timelines.
What Does This Mean for Procurement and Supply Chain Strategy?
In a market moving toward 1 TW of new capacity annually, procurement cycles are getting shorter, and supply chain resilience is becoming a key competitive advantage.
Global buyers like Moussa from Egypt, who balance quality, certifications, and delivery risk, are prioritizing:
- Flexible, certified suppliers with ISO, TUV, INMETRO documentation
- Customizable OEM solutions for branding and integration
- High-reliability products like solar pump inverters and low-voltage protection
- Guaranted delivery schedules to avoid missing peak sales seasons
At USFULL, we’ve prepared for this shift by expanding 7 production lines, increasing inventory reserves, and offering fast-track production for high-priority export markets.
Is Your Business Aligned With the 2025 Solar Surge?
The next five years will define who wins in the global solar market. With 1 TW/year on the horizon, the question is no longer if solar will lead the energy transition—but how fast you can adapt.
Make sure your procurement strategy, supplier network, and system designs are aligned with where the market is going—not where it’s been.